Logical Design for Structural, Survey and Event Database (Architecture)
Problem Statment:
Creating a unique database from 95 different datasets reflecting structural economic conditions, survey level traits and recored events for number of countries at the national, subnational, and individual level. This requires an innovative approach to database merging through logical design of Entity Relationship Diagram schema and deployment using Amazon RDS PostgreSQL engine.
Data Sources
-
Structural Data:
- Quality of Governance (QoG) primary time series dataset : This dataset belongs to the Quality of Governance Institute at the Department of Political Science at the University of Gothenburg. This basic dataset contains approximately 400 variables from 70 different data sources.
-
Household Survey Data:
- Global Data Labs (GDL) Area database contains indicators at the national and sub-national levels for low- and middle-income countries (LMICs) created by aggregating data from household survey datasets.
-
Human and Machine Coded Event Data:
- The Integrated Crisis Early Warning System (ICEWS) is a database built for the United States for the Defense Advanced Research Projects Agency (DARPA) and Office of Naval Research (ONR).
- EM-DAT is an international database on natural and technological disasters, looking at the occurrence and effects of more than 21,000 disasters in the world from (1900-2020).
- xSub is micro-level, subnational event data on armed conflict and political instability across the world.
Logical Database Modeling
The solution is to generate a logical database model that fits all the requirements for the database. logical modeling deals with gathering requirements and converting those requirements into a model. The logical model revolves around the needs of the project, not the database, although the needs of the business are used to establish the needs of the database.
Logical modeling is very important, because it affects not only the direction of database development, but also the performance of data analysis and machine learning predictions.
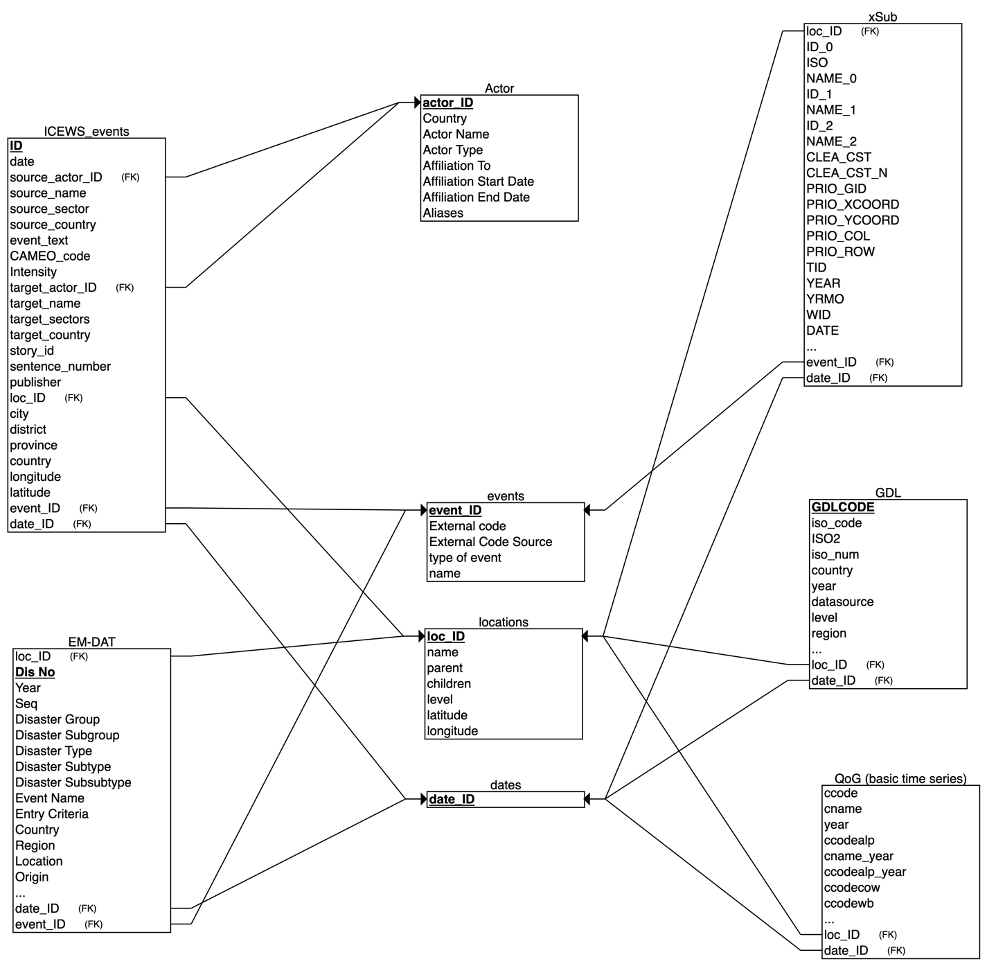
Entity Relationship Diagram (ERD)
Entity Relationship Diagram is also known as an ERD. The point of the initial ERD is to provide a picture of the different categories of data for the project, as well as how these categories of data are related to one another.
Below is a visual for the logical ERD model implemented to create the SSED database.